What Parents and Students Should Know First

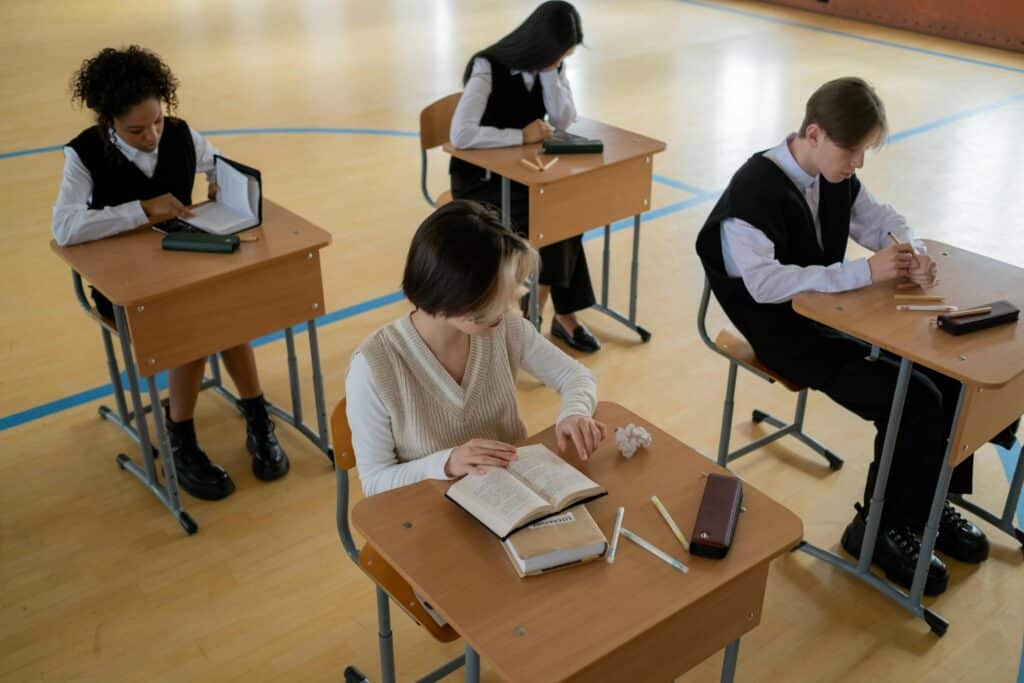
Imagine you’re driving your child to school for the first time. You pass the sleek gate of a private school, with manicured lawns and low buildings. Then, a few blocks over, you see a large public school campus buzzing with dozens of buses, diverse faces, and a mix of playgrounds and sports fields. Both places promise education. But public vs private schools is a big choice, and you want the facts to decide wisely.
There are five key differences between public schools and private schools every parent should know. These differences aren’t just about cost or prestige—they affect daily life, how students learn, and which school fits best for your family. We write blogs and articles about school, education, and learning, and our goal is to give parents and students clear information to compare public vs private schools.
Below are the five differences, with supporting statistics:
| Difference | Public Schools | Private Schools |
|---|---|---|
| Enrollment & Share of Students | About 87 % of U.S. K-12 students attend public schools (Pew Research Center, 2024). | Private schools hold about 10 % of U.S. K-12 student enrollment (Pew Research Center, 2024). |
| Graduation Rates | Graduation rate for public high schools is around 86 % (St. Thomas High School, 2023). | Graduation rate for private high schools is about 96.4 % (St. Thomas High School, 2023). |
| College Enrollment | Roughly 44 % of public school graduates enroll in a four-year college right after high school (St. Thomas High School, 2023). | For private school graduates, immediate college enrollment is about 64.5 % (St. Thomas High School, 2023). |
| Academic Performance on NAEP Tests | When factors like income are controlled, public school students perform similarly to private school students in many subjects (GreatSchools, 2023). | Private school students show higher raw averages; one NAEP study found a 14.7-point higher reading score even after adjustments (NCES, 2006). |
| Course Rigor & Advanced Opportunities | Public schools vary greatly; availability of AP or advanced classes depends on funding and district policy (CAPE Network, 2023). | Private schools more often require advanced courses and expect higher-level math, science, and language study (CAPE Network, 2023). |
These differences show clear patterns—public vs private schools each have strengths and trade-offs. Public schools serve most students, often offer more diversity, and are tuition-free except for small fees. Private schools frequently have smaller classes, more rigorous course offerings, and higher graduation and college-attendance rates. Still, when demographics are considered, academic performance often evens out (GreatSchools, 2023).
Deep Dive — Performance, Costs, and Opportunities
When families start weighing public vs private schools, three concerns rise to the top: academics, cost, and opportunities. Recent studies give a clearer picture of how these two systems compare.
Academic Performance & Outcomes
Private school students often show higher raw test scores. The U.S. Department of Education reported that private school students generally outperformed public school students on the National Assessment of Educational Progress (Council for American Private Education, 2023).
Yet a national analysis by the Institute of Education Sciences found that when factors like family income and prior achievement were considered, public school students performed nearly the same as private school students in most subjects (Institute of Education Sciences, 2006).
Long-term outcomes also differ. CAPE highlighted that students who attended private schools in eighth grade were about twice as likely to earn a bachelor’s or higher degree by their mid-20s—52 percent compared with 26 percent for public school students (CAPE, 2023).
Still, GreatSchools explains that high-performing public magnet or charter schools can match or exceed private schools when well-funded and supported (GreatSchools, 2023).
Class Size, Enrollment, and Diversity
In 2024, Pew Research Center noted that nearly 90 percent of U.S. K-12 students attend public schools, leaving about 10 percent in private education. Pew also found that more than 80 percent of private schools enroll fewer than 300 students, while public schools are far more likely to have 500 or more students.
Wilson College researchers report that private schools average about 12 students per teacher, compared with roughly 15 students per teacher in public schools (Wilson College, 2023). Smaller class sizes may allow teachers to give more one-on-one attention, though not every private school keeps ratios that low.
Public schools, on the other hand, serve a wider range of socioeconomic backgrounds and more racial and cultural diversity. The National Center for Education Statistics notes that this diversity can offer students richer social learning experiences (NCES, 2023).
Cost and Funding

Public schools are tuition-free for residents because they receive local, state, and federal funding. Private schools rely on tuition, donations, and endowments. Even with scholarships, the Private School Village reports that tuition remains a major expense for most families (Private School Village, 2023).
Experts at Agile Education explain that these different funding sources shape what resources and programs schools can offer, from technology to extracurricular activities (Agile Education, 2023).
According to the Education Data Initiative, the average U.S. private K-12 tuition is over $12,000 a year, with elite schools charging much more (Education Data Initiative, 2024).
Opportunities Beyond Academics
Private schools often provide more Advanced Placement or International Baccalaureate courses, and many require students to take advanced math, science, or foreign language classes (CAPE, 2023). Public schools vary widely; well-funded districts and magnet programs can offer similar opportunities, but lower-funded districts may have fewer AP courses (NCES, 2023).
In extracurriculars, public schools sometimes have an edge in large sports programs or specialized clubs because of their bigger student populations and state funding (GreatSchools, 2023).
How Our Blogs & Articles Help
Our blogs and articles about school and education and learning turn complex statistics into clear charts and stories so parents and students can make smart choices.
Key Comparison Table
| Factor | Public Schools | Private Schools |
|---|---|---|
| Standardized Test Scores | Similar to private schools when background factors are considered (IES, 2006) | Higher averages before adjustments (CAPE, 2023) |
| College Degree by Mid-20s | About 26 % (CAPE, 2023) | About 52 % (CAPE, 2023) |
| Student-Teacher Ratio | ~15:1 (Wilson College, 2023) | ~12:1 (Wilson College, 2023) |
| Average Tuition | Free (tax funded) | About $12,000 yearly on average (Education Data Initiative, 2024) |
| Enrollment Share | Nearly 90 % of U.S. students (Pew, 2024) | About 10 % of U.S. students (Pew, 2024) |
By looking at these data points, parents and students can decide which factors—cost, academic rigor, diversity, or class size—matter most for their own situation.
Making the Right Choice
Choosing between public vs private schools is about more than just numbers. It’s about what fits your child’s learning style, your family’s budget, and your community values. The statistics from Section 2 show that private schools often have smaller classes and higher graduation rates (CAPE, 2023), while public schools serve most students and offer greater diversity (Pew, 2024).
Steps for Parents and Students
- Set Priorities: Decide if cost, academic rigor, diversity, or class size matters most.
- Visit Campuses: Walk through classrooms, talk with teachers, and observe student interactions.
- Ask Key Questions: “How many AP or honors courses do you offer?” “What support exists for special learning needs?”
- Compare Outcomes: Look at graduation rates, college acceptance data, and extracurricular offerings.
- Check Funding & Resources: Understand how each school pays for technology, arts, and sports programs.
- Talk to Families: Ask parents and students already enrolled about their daily experiences.
Why Both Paths Can Work
- Strong Public Options: Magnet and charter programs often rival private schools in academics (GreatSchools, 2023).
- Personal Attention in Private Schools: Smaller student–teacher ratios can mean more one-on-one support (Wilson College, 2023).
- Community Connections: Public schools can offer a wider mix of backgrounds and cultures, while private schools may share specific religious or educational missions.
Our blogs and articles about school and education and learning help families use these steps. We break down research, share real stories, and give clear checklists so parents and students can match local school options to their own needs.
Key Takeaways
Choice Depends on Family Goals: The “best” school is the one that fits your child’s learning style and your values.
Cost: Public schools are tuition-free; private schools average over $12,000 yearly (Education Data Initiative, 2024).
Class Size: Private schools average about 12 students per teacher vs. 15 in public schools (Wilson College, 2023).
College Readiness: Private school students are about twice as likely to earn a bachelor’s degree by their mid-20s (CAPE, 2023).
Diversity: Public schools typically enroll a more diverse student population (NCES, 2023).
Performance Gap: After adjusting for income and background, test score differences shrink (Institute of Education Sciences, 2006).
Works Cited
Wilson College. “Private School vs Public School: Which Is Better?” 2023. https://online.wilson.edu/resources/private-school-vs-public-school
Agile Education. “How Funding in Education Impacts Public and Private Schools.” Agile Education, 2023. https://agile-ed.com/resources/how-funding-in-education-impacts-public-and-private-schools
Council for American Private Education (CAPE). “Academic Performance of Private School Students.” CAPE Network, 2023. https://capenetwork.org/academic-performance
Education Data Initiative. “Average K–12 Private School Tuition.” 2024. https://educationdata.org/average-private-school-tuition-k-12
GreatSchools. “Comparing Private and Public School Test Scores.” 2023. https://www.greatschools.org/gk/parenting/school-ratings/comparing-private-public-school-test-scores
Institute of Education Sciences (IES). Comparing Private Schools and Public Schools Using Hierarchical Linear Modeling. U.S. Department of Education, 2006. https://ies.ed.gov/ncee/pubs/2006/2006461/index.asp
National Center for Education Statistics (NCES). “Digest of Education Statistics.” 2023. https://nces.ed.gov/programs/digest
Pew Research Center. “Public, Private and Charter Schools in 5 Charts.” 2024. https://www.pewresearch.org/short-reads/2024/06/06/us-public-private-and-charter-schools-in-5-charts
PNAS (Proceedings of the National Academy of Sciences). “Family Background and School Effects on Student Outcomes.” 2012. https://www.pnas.org/doi/10.1073/pnas.1112742109
Private School Village. “Private School vs Public School Debate: Statistics, Pros, and Cons.” 2023. https://www.privateschoolvillage.org/post/private-school-vs-public-school-debate-statistics-pros-and-cons